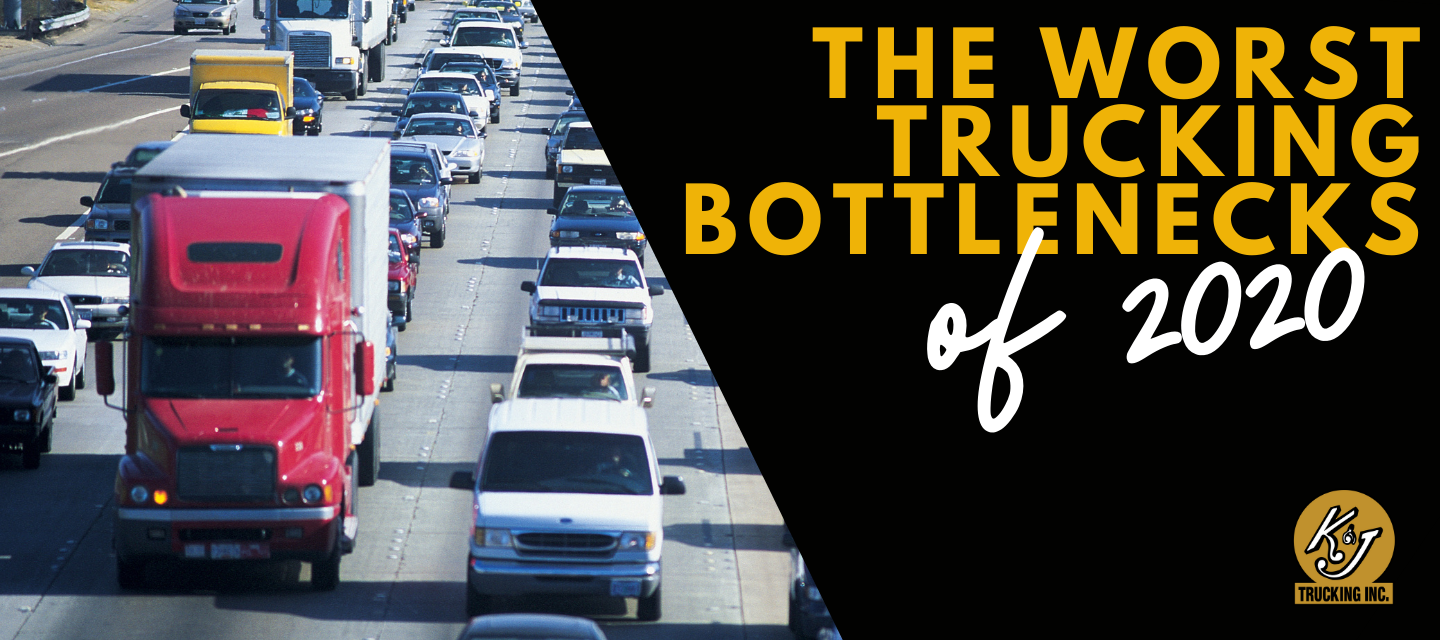
When you need to get somewhere, getting stuck in traffic is the worst. As you know, it’s more than just an annoyance for truck drivers, it lowers your ability to make money and deliver on time. Having to navigate frustrated motorists while carrying time sensitive loads and worrying about hours of service requirements can be a tough balancing act. Planning alternate routes and even adjusting the time of the day spent driving has become essential to an on-time delivery in some areas. But how do new drivers learn the places to avoid?
One place to check is the American Transport Research Institute (ATRI)’s list for the worst trucking bottlenecks which is released each year. While the data is a great conversation starter and contains fun pieces of trivia, there was also a worthy goal in mind: the Department of Transportation hopes to use the information to better allocate infrastructure funds to the most problematic areas. And that is something that should make all drivers around the country happy!
You can visit the ATRI’s website for the full list of bottlenecks and to see if your “favorite” traffic jam made the cut.
Here are the top ten worst offenders for 2020:
10. SAN BERNARDINO, CA I-10 TO I-15 JUNCTION
Average speed: 46.7 MPH
Peak average speed: 40.7 MPH
Non-peak average speed: 49.1 MPH
Peak average speed change: 25.1%
9. RYE, NY I-95 TO I-287 JUNCTION
Average speed: 47.5 MPH
Peak average speed: 45.7 MPH
Non-peak average speed: 48 MPH
Peak average speed change: 12%
8. ST. LOUIS, MO I-64/I-55 TO I-44 JUNCTION
Average speed: 47.3 MPH
Peak average speed: 46.1 MPH
Non-peak average speed: 47.7 MPH
Peak average speed change: 10.1%
7. CHATTANOOGA, TN I-75 AT I-24 JUNCTION
Average speed: 49.3 MPH
Peak average speed: 46.8 MPH
Non-peak average speed: 50.4 MPH
Peak average speed change: -1.8%
6. CHICAGO, IL I-290 AT I-90/I-94 JUNCTION
Average speed: 28.8 MPH
Peak average speed: 25.4 MPH
Non-peak average speed: 30.1 MPH
Peak average speed change: 57.6%
5. HOUSTON, TX I-45 AT I-69/US 59 JUNCTION
Average speed: 40.2 MPH
Peak average speed: 31.4 MPH
Non-peak average speed: 44.1 MPH
Peak average speed change: 53.7%
4. ATLANTA, GA 1-20 AT I-285 (WEST) JUNCTION
Average speed: 45.1 MPH
Peak average speed: 40.9 MPH
Non-peak average speed: 46.8 MPH
Peak average speed change: 12.6%
3. ATLANTA, GA I-285 AT I-85 (NORTH) JUNCTION
Average speed: 42.6 MPH
Peak average speed: 34.4 MPH
Non-peak average speed: 46.3 MPH
Peak average speed change: 53.5%
2. CINCINNATI, OH I-71 AT I-75 JUNCTION
Average speed: 44.1 MPH
Peak average speed: 40.1 MPH
Non-peak average speed: 45.7 MPH
Peak average speed change: 11.5%
1. FORT LEE, NJ AT SR 4 JUNCTION (GEORGE WASHINGTON BRIDGE)
Average speed: 36.5 MPH
Peak average speed: 31.3 MPH
Non-peak average speed: 38.5 MPH
Peak average speed change: 39.4%
How the Numbers Were Compiled
If you are just looking at the numbers, it may seem random how they assigned the bottleneck rankings, but it’s not. To compile the list, the ATRI gathered and aggregated GPS data from over one million trucks during 2020. They then used a complex formula based on many different data points that measured the impact of congestion on truck speeds.
In layman’s terms: they took a truck’s average speed and multiplied it by the number of trucks traveling through an area in a 24-hour period.
There are also other considerations such as the average speed during peak and non-peak hours, as well as the peak speed change from 2019 to 2020. However, like most things this year, the data was not immune from the effects of COVID-19. Half the year was spent in a flatten the curve mandate which resulted in a lower than expected total number of vehicles on the road and therefore less congestion overall for truckers.
In addition, the increasing use of real-time traffic monitoring apps such as Waze and Google Maps provided drivers with alternate routes which likely helped general traffic flow. Less congestion was a positive note in a year full of many pandemic-related challenges to truckers and the trucking industry.
A Traffic Reminder...
If you find yourself stuck in one of these - or any other - traffic jam, you know the drill: slow down, keep the appropriate distance between you and other vehicles, and remain calm. Try taking some deep breaths or listening to your favorite music, XM station, or podcast. If you focus on staying positive, you’ll be moving along again before you know it!
You can read more about the full methodology used to calculate the bottleneck rankings here.
